Introducing the New Airbnb Listing Quality Dashboard in Channex
Airbnb has become more demanding about quality metrics. Channex's new dashboard shows your entire performance picture, week-by-week, with metrics that actually matter for ranking and guest conversion.

Airbnb has quietly become more demanding about quality metrics — review scores, listing tags, guest complaints, operational issues, and even tiny details like "hard to find" or "not private."
These signals now directly affect how visible a listing is in search results.
But the problem?
Airbnb's own analytics are scattered, vague, and hard to compare over time.
So we built something better.
Today we're launching the Airbnb Listing Quality Dashboard inside Channex: a single screen that shows your entire performance picture, week-by-week, with the metrics that actually matter for ranking and guest conversion.
What the Dashboard Actually Does (in plain English)
This isn't just another chart page.
It answers the three questions every Airbnb host has — but Airbnb doesn't tell you directly:
1. Am I improving or getting worse?
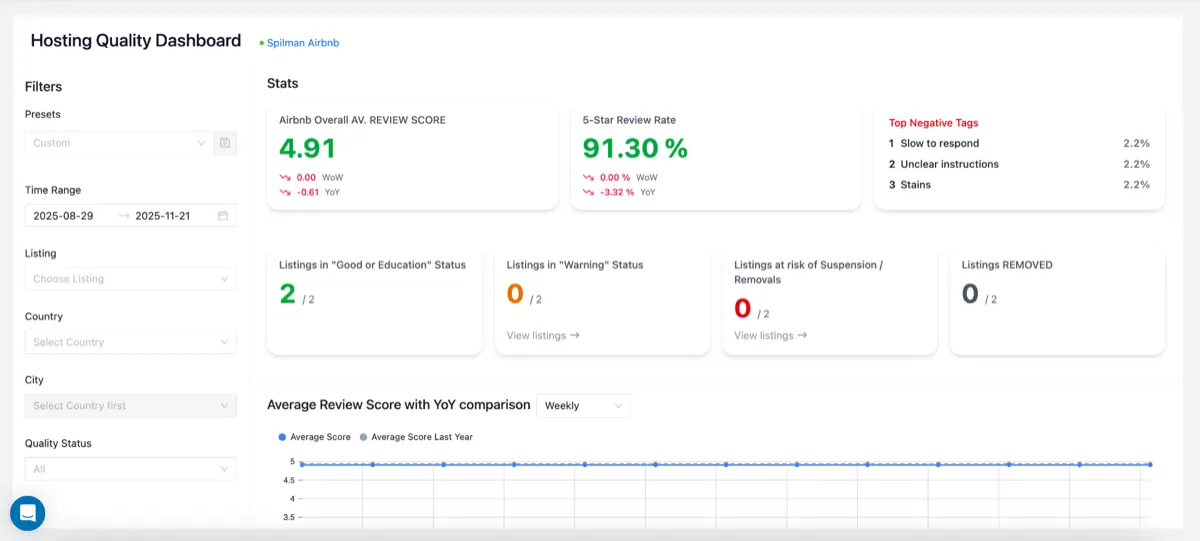
You see your overall review score and 5-star rate with week-over-week and year-over-year comparisons.
If your 5-star rate is drifting down, you'll know before Airbnb punishes you for it.
2. Which listings are at risk?
Airbnb quietly flags listings internally as:
- Good / Excellent
- Warning
- At risk of removal
- Removed
We surface these badges in a simple status widget.
No guesswork.
No "why is my listing dropping in search?"
If a listing hits "Warning," you see it immediately.
3. What exactly are guests complaining about?
Airbnb generates tags from guest reviews.
They matter more than most hosts realise.
We break them down by category:
- Location
- Check-in
- Accuracy
- Communication
- Cleanliness
Each shows the top positive tags (what guests love)…
and the top negative tags (what hurts your scores).
Example:
If "Broken lock on door" appears even a few times, you'll see its exact percentage impact — no digging through reviews manually.
Charts That Mean Something (Not Just Pretty Lines)
We include three core time-series charts:
- Average Review Score (Weekly)
- 5-Star Review Rate (Weekly)
- Category Scores Over Time
Most tools stop at "your score is 4.91."
That's useless.
What matters is: are you trending up or down?
This dashboard makes that obvious.
If cleanliness drops before high season, you'll catch the pattern early.
Why We Built This (the honest reason)
Airbnb quality scoring has become a black box.
Hosts constantly ask:
- "Why am I losing search ranking?"
- "Why did my listing drop to page 5?"
- "Why did Airbnb send me a warning email out of nowhere?"
Airbnb gives the data, but in a fragmented, confusing way.
Channex already sits in the middle of PMS → Airbnb → OTA data.
So it made sense to clean it up, standardise it, and present it in a way real hosts can use.
This dashboard is the result.
Who This Feature Is For
- Individual hosts wanting to maintain high visibility
- Property managers with 10, 50, or 200+ listings
- PMS companies who want to give their customers more value
- Revenue managers who use Channex to monitor performance
- Anyone who hates digging through Airbnb's clunky interface
If you handle multiple Airbnb listings, this is the first tool that makes quality performance actually understandable.
Final Thoughts
Airbnb is pushing listings harder than ever based on quality, reliability, and consistency.
This dashboard helps you:
- Spot issues before Airbnb does
- Improve review scores intentionally
- Understand why your ranking changes
- Get ahead of negative tags
- Stay in "Good / Excellent" status
It's simple, clear, and practical — exactly what most hosts need.